Contents:
Debugger
PTK includes an integrated debugger that allows any code that is exectuted in an engine to be debugged, whether it was entered in the console directly, inside a script file run using execfile(), or inside a module that is imported and used. The debugger is enabled using the engine toolbar in the console window (see here).When code is run in the console with the debugger enabled it will execute until a breakpoint is encountered or a pause request is recieved (via the pause button on the debugger toolbar - which will pause the code at the next line). At this point the debugger prompt ('DB>') will appear in the console and the debugger will wait for further instructions.
Note: The debugger is only enabled for the current engine - when switching engines the engine toolbar will update to show the state of the debugger for the new engine.
Controlling the debugger
The debugger can be controlled using the debugger toolbar (shown below) in the console window or by entering commmands at the console prompt. These take the form of python code comments to differentiate then from arbituary python code. The table below lists the commands. Other python comments entered at the prompt will be ignored and only a single command can be entered at a time.Other python code can also be executed at the debugger prompt - for example the variables defined in a scope can be manipulated or inspected. Many tools can be used seamlessly with the debugger mode - for example if the namespace browser is refreshed the namespace of the current debugger scope will be displayed. It is also possible to change the values of objects in any scope to alter the program flow or test for certain cases.

| Command | Toolbar button | Action |
|---|---|---|
| #help (or #h) | Show the debugger help text. | |
| #step (or #s) | Step to the next line of code. | |
| #stepin (or #si) | Step into a new code block that is being called. | |
| #stepout (or #so) | Step out of the current code block. | |
| #resume (or #r) | Resume running the code until the next breakpoint or pause. | |
| #setscope level (or #ss level) | Set the active scope, level is an integer scope level where 0 is the main user namespace. | |
| #line (or #l) | Print the current line of source (if available) in the console. | |
| #end (or #e) | Disable debugging and finsishing running the code - no further debugging can be performed. |
Note: These commands are case insensitive, e.g. #step, #Step, #STEP, #S and #s will all instruct the debugger to step to the next line.
Setting breakpoints
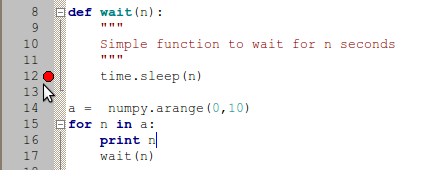
Breakpoints are set in by opening the source file in the editor and clicking on the margin to the right of the lines numbers. This will set a breakpoint at that line in the code, and if during code execution the line is about to be executed the debugger will pause. To clear a breakpoint click on the breakpoint marker in the margin. Breakpoints can also be conditional (an arbitrary python expression can be evaulated to decide whether to break or not), temporary (the breakpoint will only trigger n times) or delayed (the breakpoint will only trigger after it has been encountered n times). To access these features [ctrl] click on the margin or an existing breakpoint marker and the edit breakpoint dialog will appear.The colour of the breakpoint marker in the editor indicates it's state - red means the breakpoint is active (the debugger is enabled for the current engine and the file is unchanged. Yellow indicates that the debugger is active but the file has been modified so the breakpoint may not be set at the correct line - saving the file will update the breakpoint to the correct line. White indicates that the debugger is disabled for the current engine, so the breakpoint is inactive.
Active breakpoint (debugger is enabled)

Active breakpoint - file modified, so breakpoint lineno may be incorrect.

Inactive breakpoint (debugger is disabled)

